UN Says Melting Arctic Ice is a Key Indicator of Climate Change—But It's Not Melting
Climate policy based on an assumed relationship between CO2 and Arctic ice levels is problematic, say scientists.


“Questioning the data.
NOTE: this article was originally published to TheEpochTimes.com on June 12, 2023.
Climate policy based on an assumed relationship between CO2 and Arctic ice levels is problematic, say scientists.
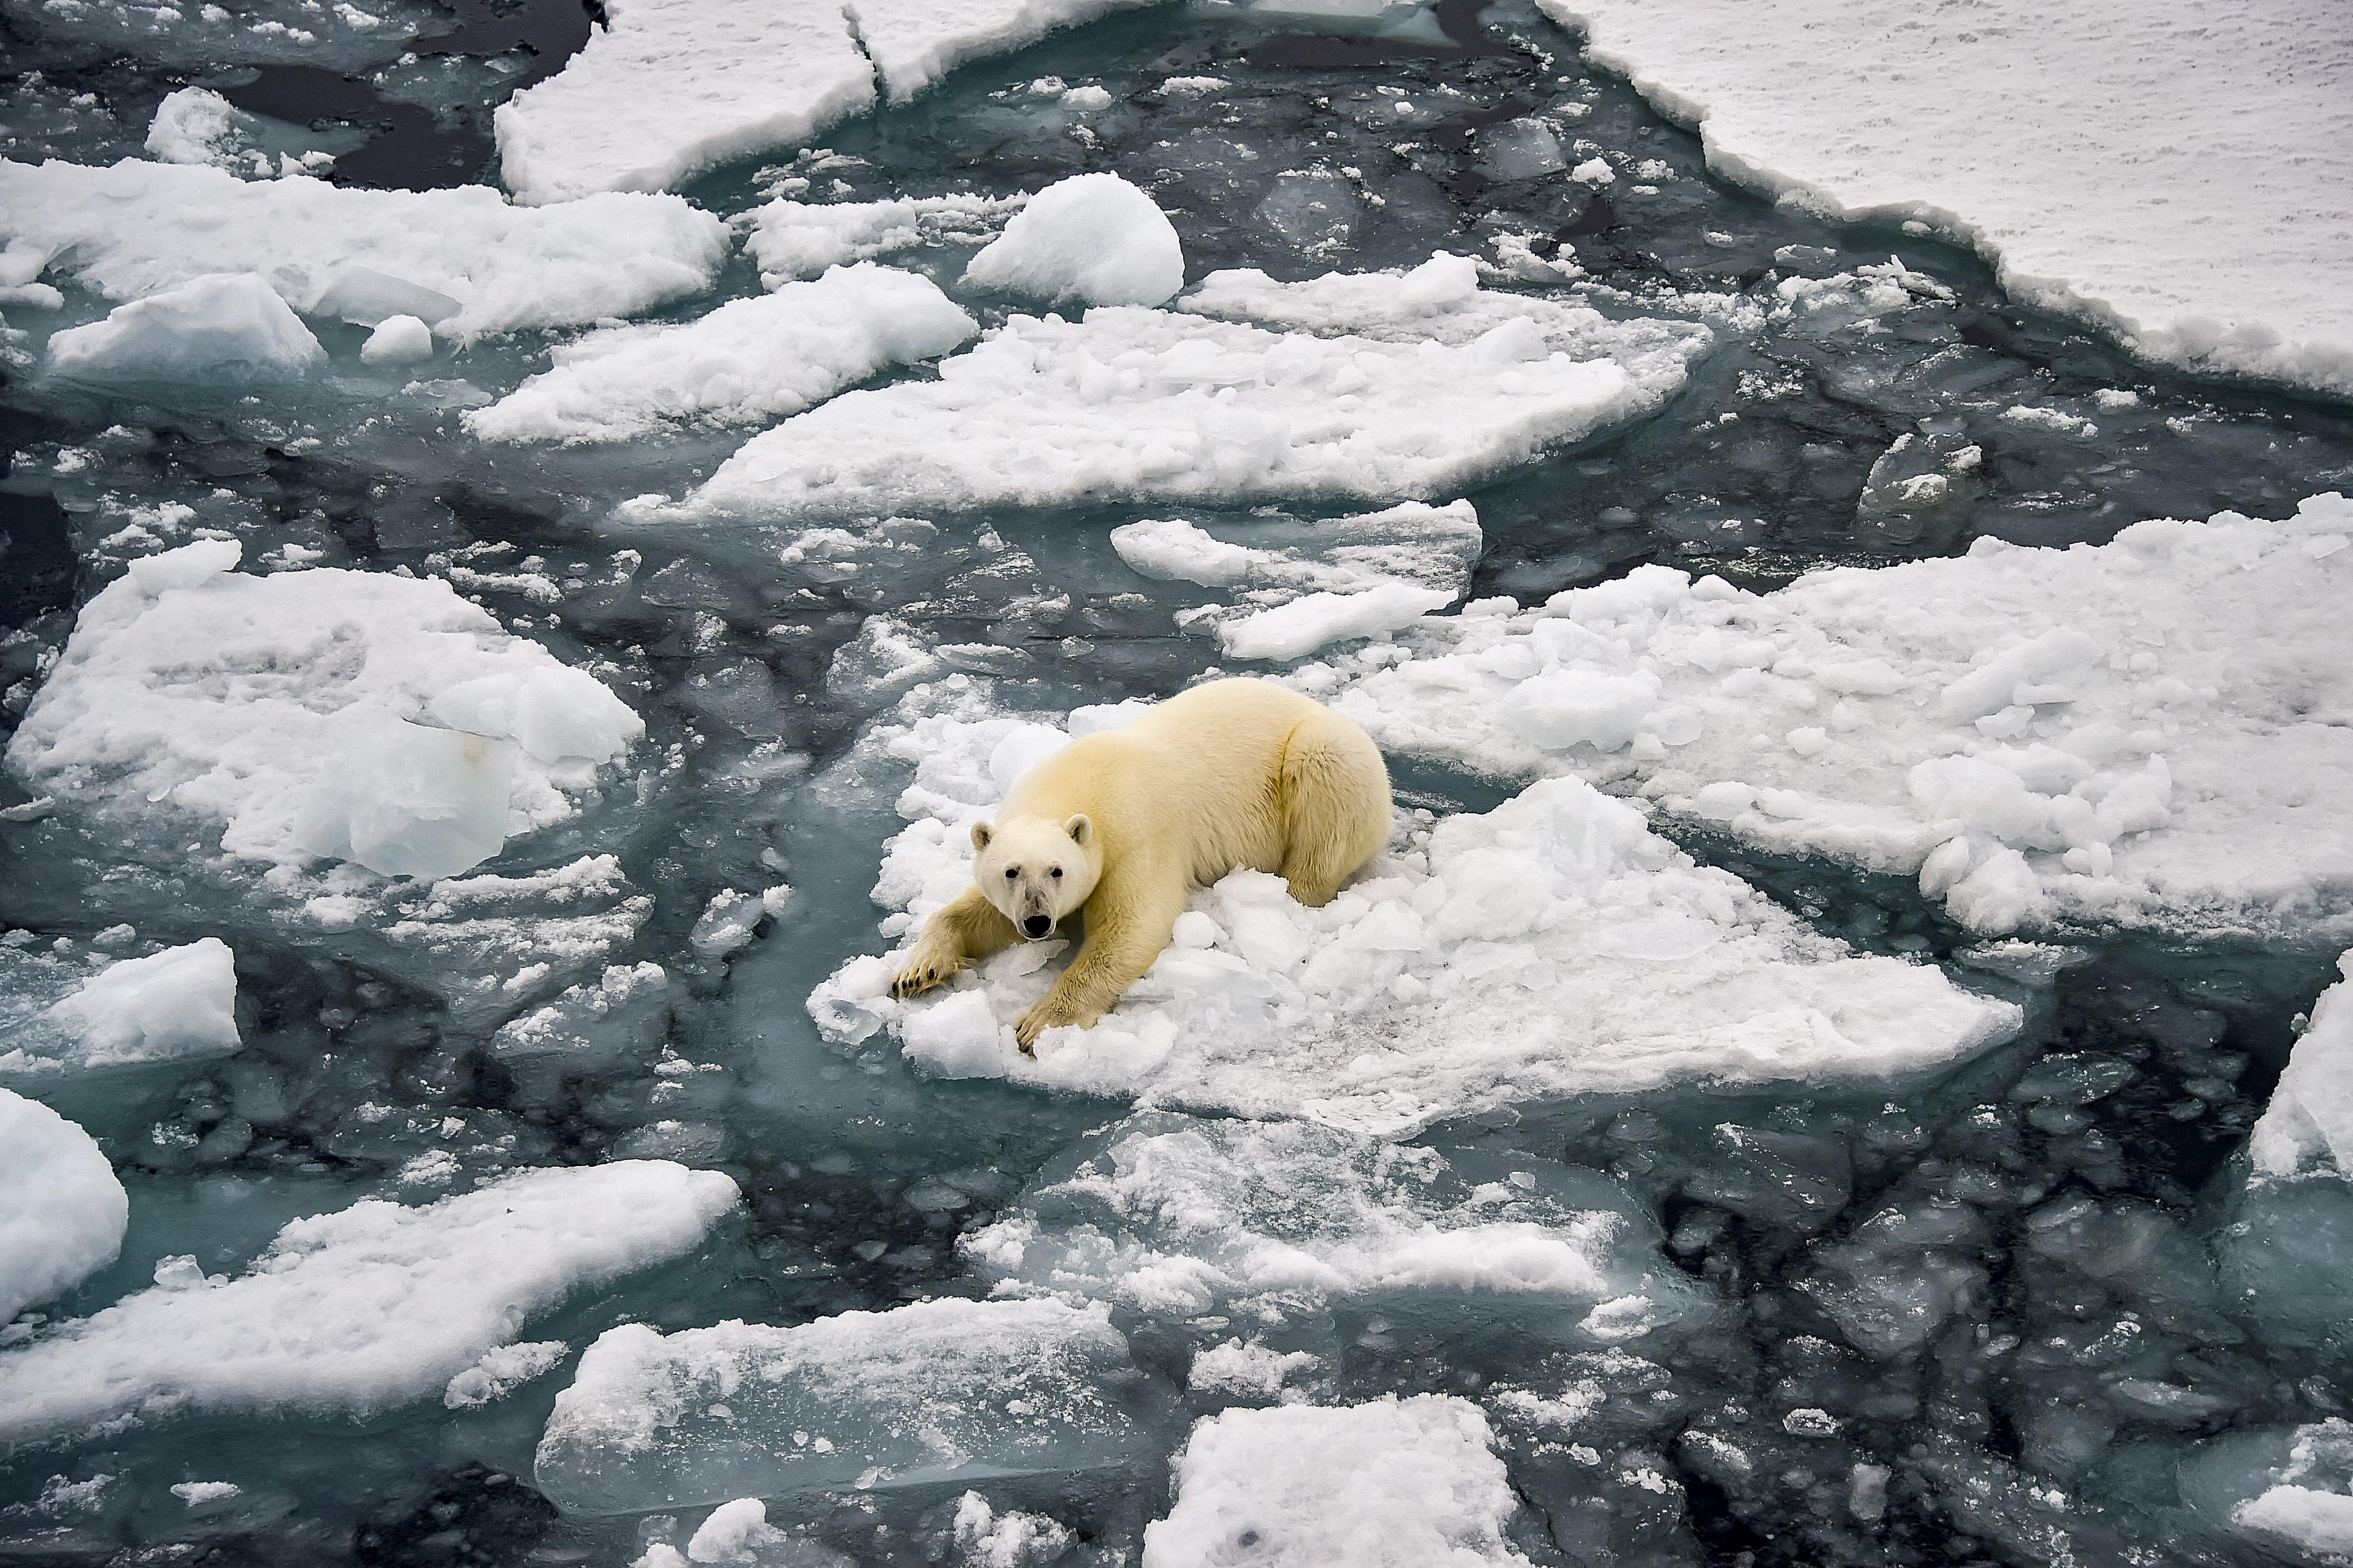
It’s bad news for polar bears, according to the most recent assessment report by the Intergovernmental Panel on Climate Change (IPCC), a United Nations organization.
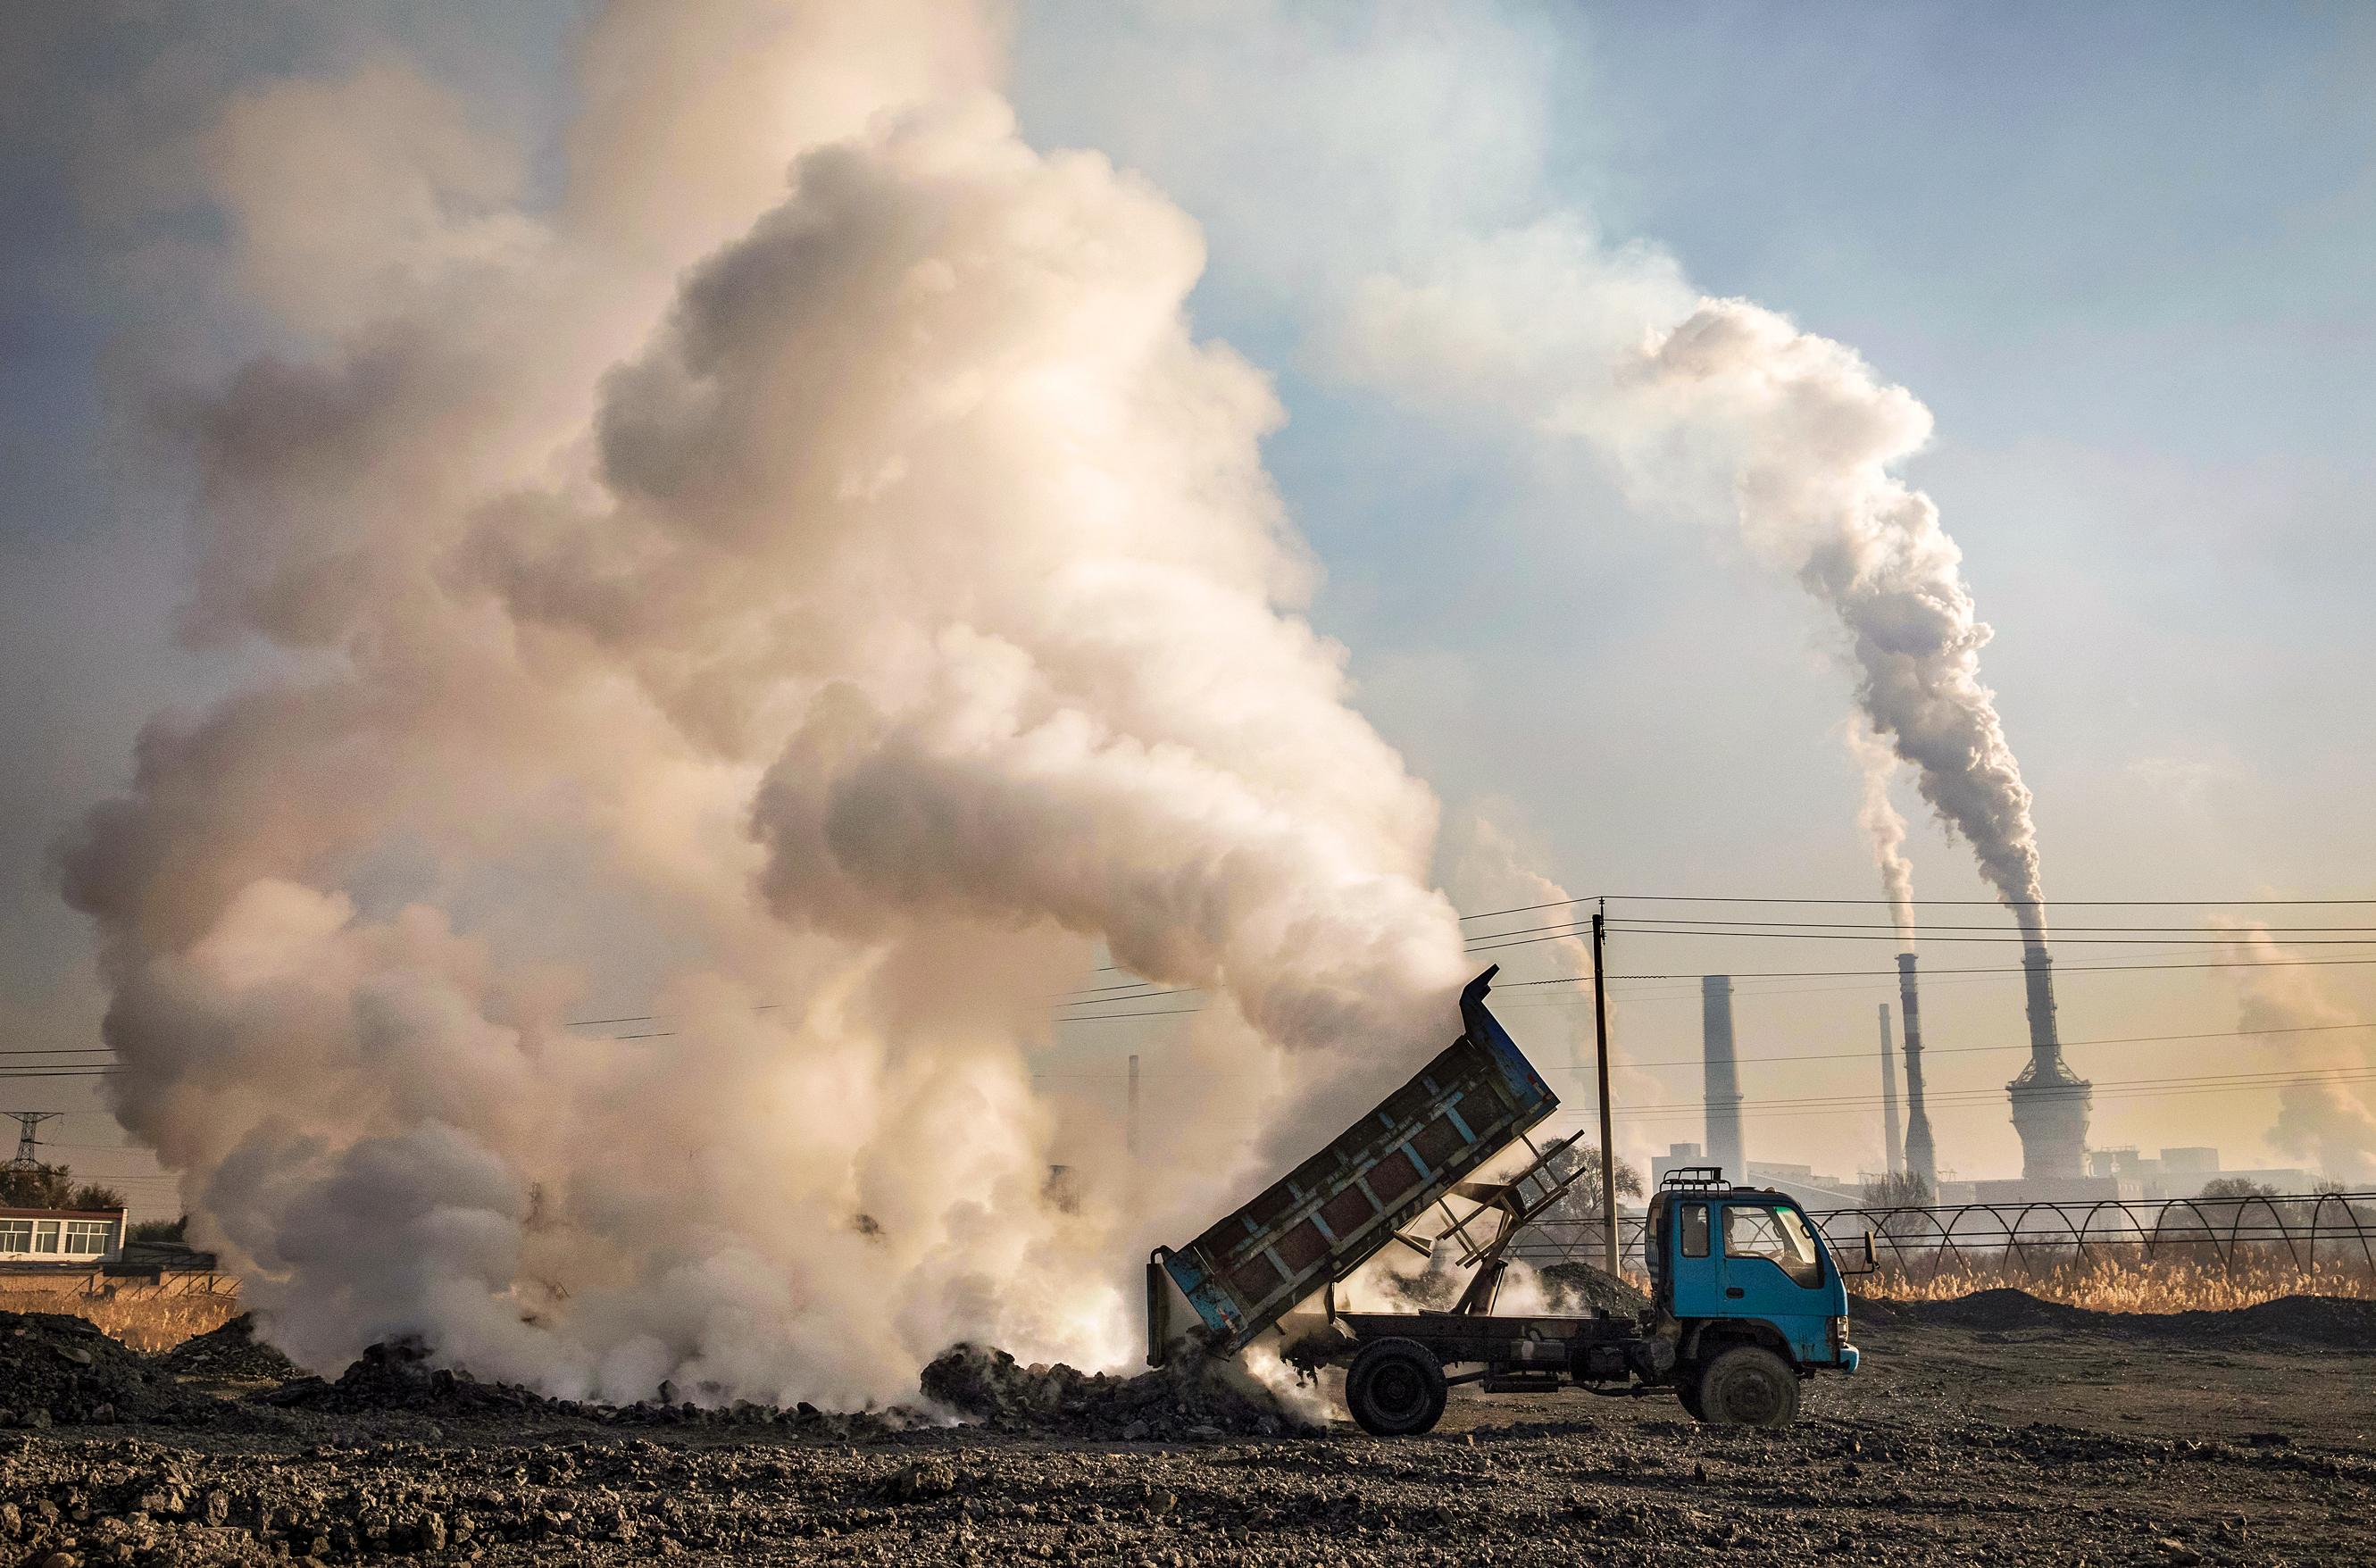
Because of increasing carbon dioxide (CO2) and other greenhouse gas emissions, modeling and simulations predict the Arctic will be without ice during the month of September by 2050.
“We project an ice-free Arctic in September under all scenarios considered,” a scientific report highlighting IPCC’s findings states.
“These results emphasize the profound impacts of greenhouse gas emissions on the Arctic.”
A similar prediction was made in 2013, but at that time, the prediction was for no ice by about 2033.
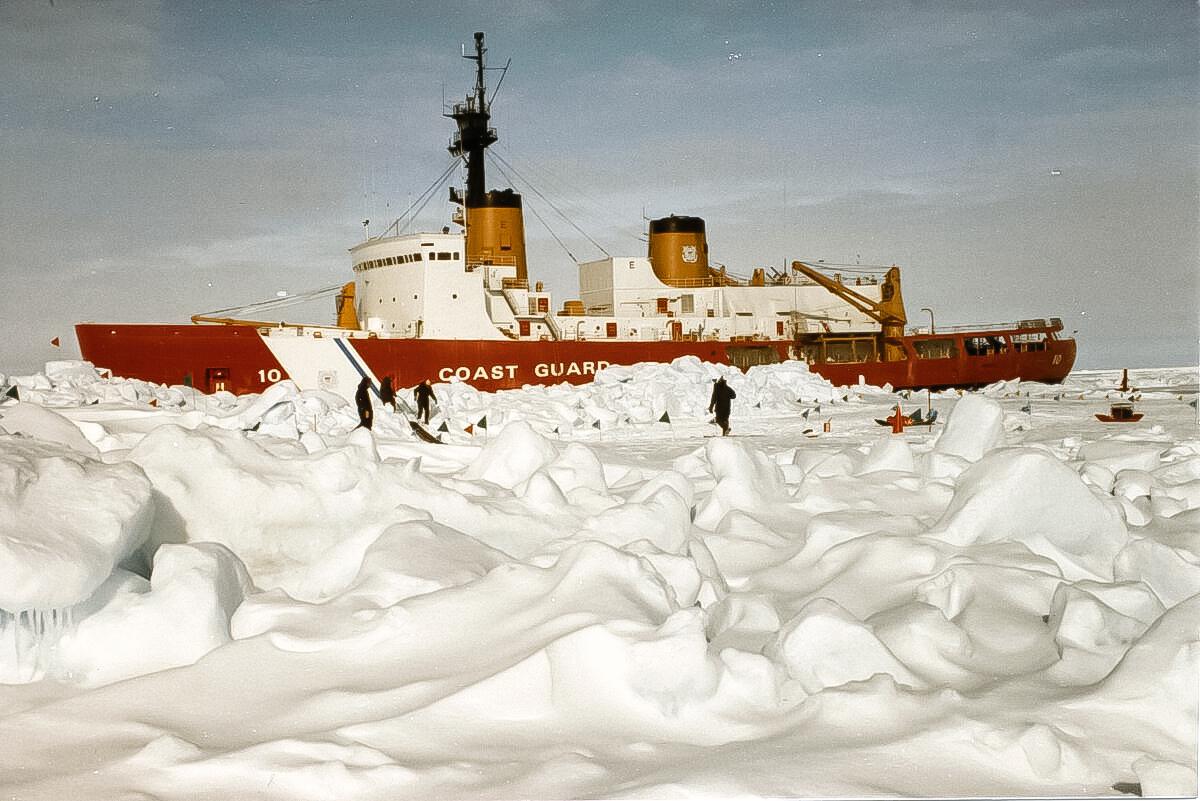
“All climate models are projecting an ice-free summer within the next 20 years or so,” Ron Kwok, a senior research scientist at NASA’s Jet Propulsion Laboratory said in July 2013. “It’s not very far away.”However, a new report by Allan Astrup Jensen, the research director and CEO at the Nordic Institute of Product Sustainability and Environmental Chemistry and Toxicology in Denmark, shows that from September 2007 through September 2023, Arctic sea ice declines were near zero.“The facts are that the Arctic Sea ice extent measured by satellites since 1978 expresses annual variations, and it has declined considerably from 1997 to 2007. However, before that time period, from 1978 to 1996, the downward trend was minimal, and in the last 17 years, from 2007 to 2023, the downward trend has also been about zero,” the report states.“Therefore, there is no indication that we should expect the Arctic Sea summer ice to disappear completely, as predicted, in one or two decades.”Mr. Jensen told The Epoch Times that the IPCC and other organizations “exclude the possibility that the sea ice extent may expand in the future and even reach levels from before 1996.“That is because they believe that the driver of the sea ice extent is the predicted warming by rising CO2 levels in the troposphere.”Frank Geisel is an ocean engineer and naval architect, who examined ice thickness in the Arctic and Antarctic with the Coast Guard over several expeditions in the 1980s.He said it’s problematic to measure sea ice extent and ice thickness and then conclude that CO2 is driving a decline and should then be mitigated.“We can’t just issue a command and say, ‘If we do this, then this will happen,’” Mr. Geisel told The Epoch Times. “Well, maybe. But maybe not.”
CO2 and Sea Ice
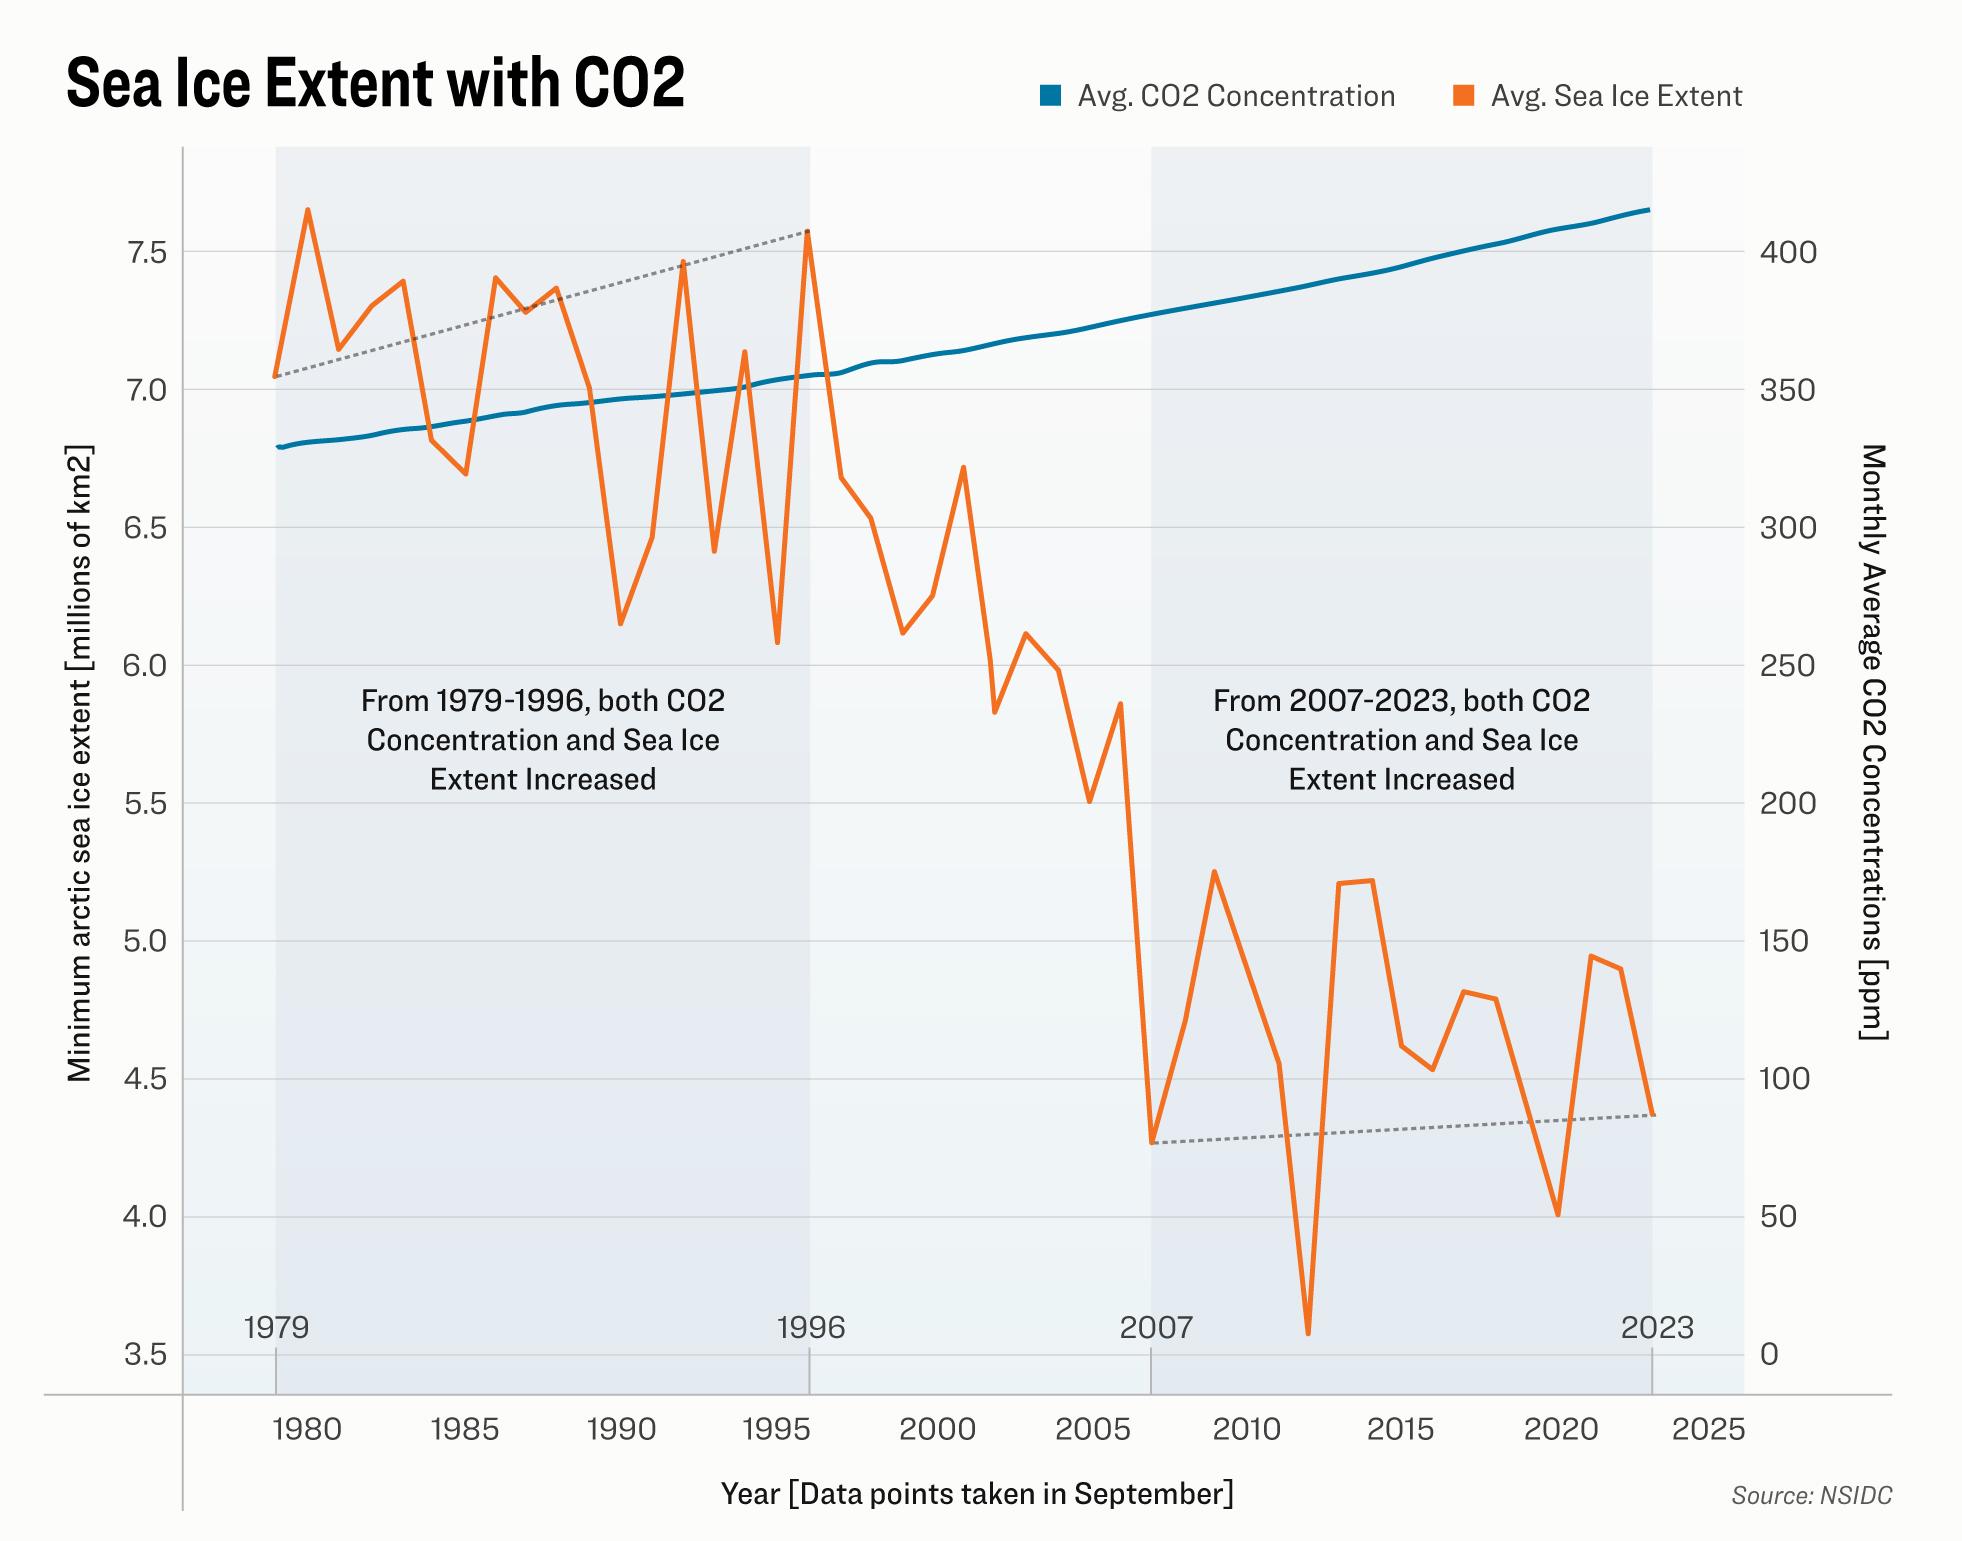
The National Oceanic and Atmospheric Administration (NOAA) uses NSIDC data to record Arctic sea ice yearly minimums in September, at the end of the summer melt season. The measurement is based on sea ice extent, which is the square mileage of ice covering the Arctic Ocean during a specified time.
In September 1979, NOAA reported that the Arctic sea ice yearly minimum was 2.72 million square miles. At that same time, CO2 concentrations were 337.1 parts per million (ppm), according to The Nature Conservancy.Nearly 20 years later, in 1996, CO2 concentrations had risen to 362.58 ppm, and the September Arctic sea ice yearly minimum had increased to 2.93 million square miles.After 1996, the sea ice extent declined until 2007, with the most significant drop occurring between 2006 and 2007—from 2.26 million square miles in 2006 to 1.65 million square miles by 2007. CO2 concentrations were 383.37 ppm.After the 2007 results were released, the American Geophysical Union issued a report warning that the Arctic may be “on the verge” of a fundamental change, and images of starving polar bears stranded on floating ice slabs became commonplace.Due in part to their declining habitat, on May 15, 2008, polar bears were listed as “threatened” under the Endangered Species Act.But the sea ice extent recordings in the Septembers of 2008 and 2009 increased, and despite hitting a record low in 2012, from 2007 to 2023, sea ice declines have been close to zero.
In September 2023—during what NOAA’s Ms. Kapnick called “by far” the warmest year in NOAA’s 174-year climate record—the Arctic sea ice yearly minimum was 1.69 million square miles, an increase of about 40,000 square miles from 2007. CO2 was 421.55 ppm in 2023.Mr. Jensen said a couple of years ago he started to make and post charts and diagrams with NSDIC’s data to provide people with simple visual representations.“My first diagram I did send to NSIDC but I got no reaction from that organization. It surprised me. It has also surprised me that many people, including scientists and even friends, are difficult to convince that the sea ice has been unchanged since 2007, although I use the same official data also used by the IPCC,” Mr. Jensen said.“They are brainwashed by the many alarmist news articles telling about a decrease in the Arctic Sea ice, and [by] their great respect for the U.N. organization, IPCC.”
Mr. Geisel said he’s concerned some scientists and policymakers are using “a very precise, almost microanalysis on a very, very macro situation.”
“We’re looking at processes that change over decades, and we’re trying to understand how we’re going to respond this year,” Mr. Geisel said.
“If you study the weather systems in the high Arctic, there’s a tremendous high-pressure system that’s well known by weather geeks, that sits on the top of the Pole… And it shifts, and it’s well known that it shifts positions and thus changes the weather patterns on a decadal frequency—we’re talking 10, 12 years.
“Those are really massive, longer-term processes that all of our technology can’t fully understand.”
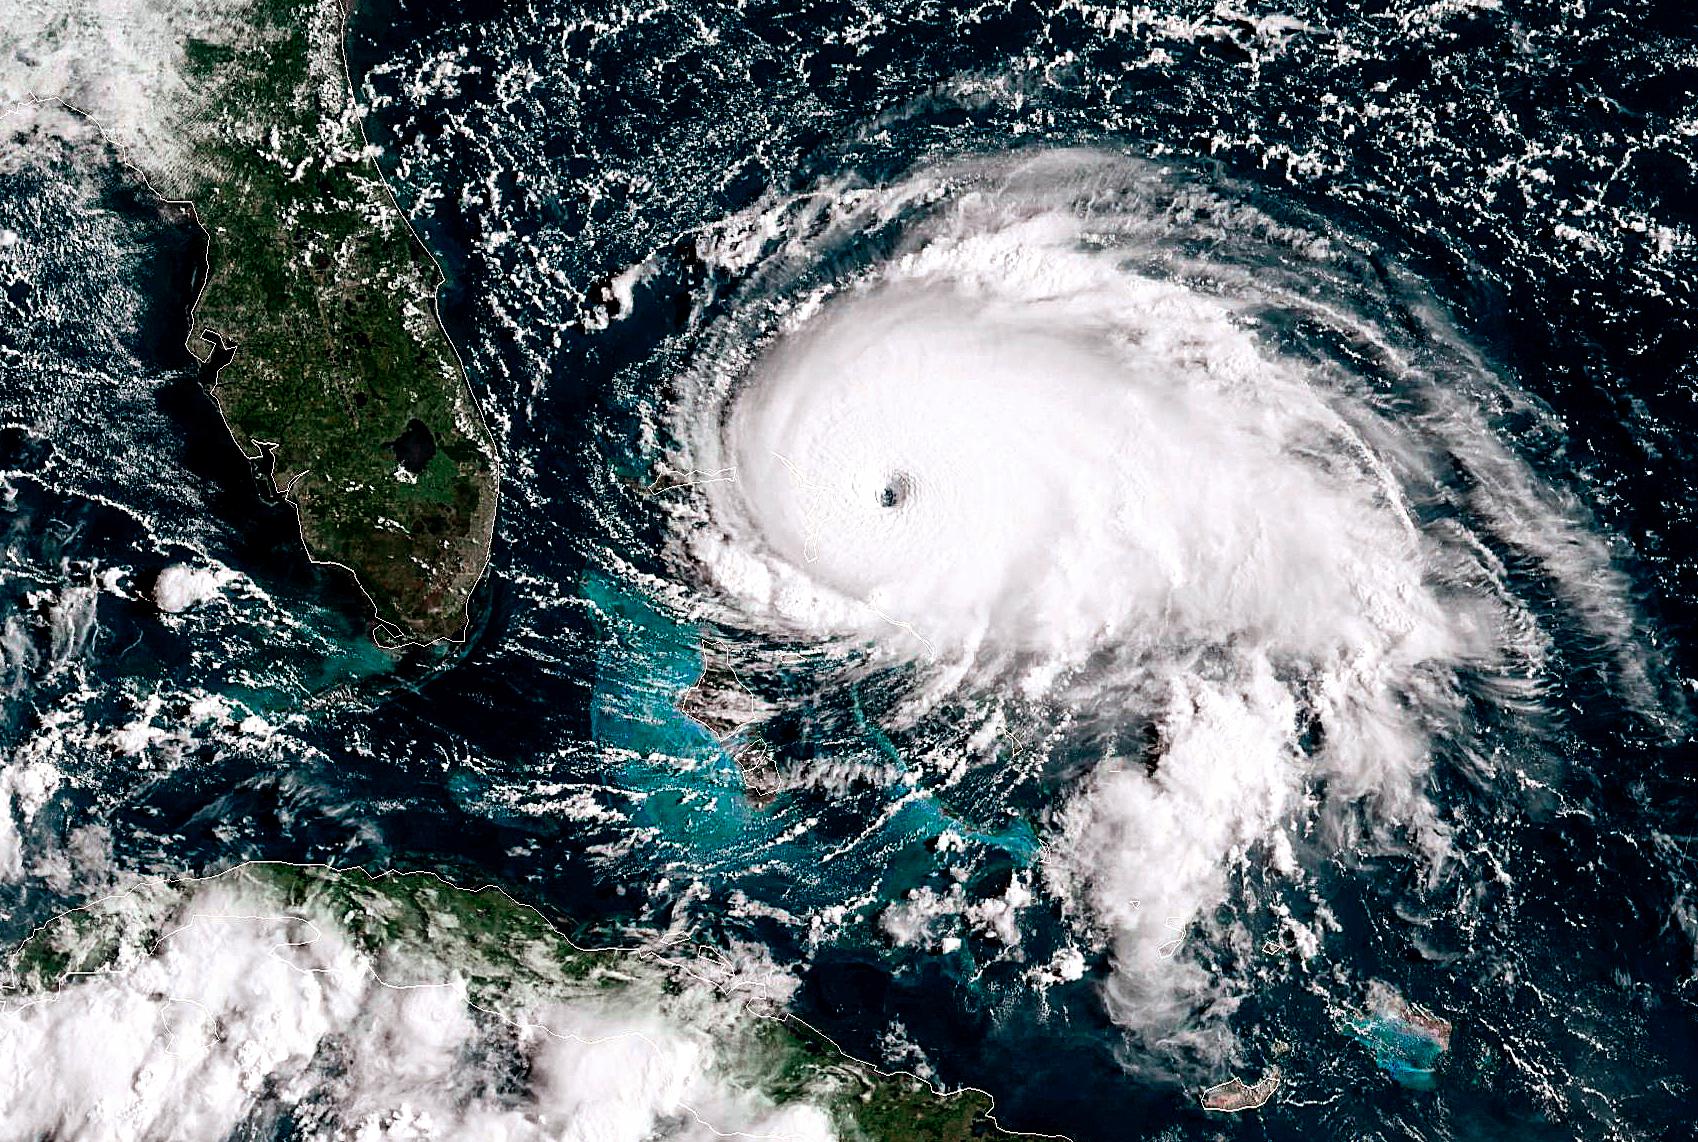
Mr. Geisel made the comparison to scientists who closely study hurricanes via satellite imagery and who still aren’t able to fully understand how they’ll behave in the near future.
“We have all this imagery, and we can model [hurricanes] very carefully, and they can be modeled down to a scale of about 100 meters,” he said.
“But the mitigation of it as it’s coming to shore isn’t done on a 100-meter basis. It’s done on a 100-mile basis. When a hurricane comes to the coast of Florida, the governor says, ‘Everybody out!’ So, the resolutions of these measurements don’t necessarily equate to mitigation or even an understanding of the consequences.”
Questioning the Data
NSIDC takes satellite measurements of sea ice and records where ice concentrations are at least 15 percent to understand sea ice extent. NOAA then uses the September measurements to plot sea ice extent over time.
But the margin of error is significant.
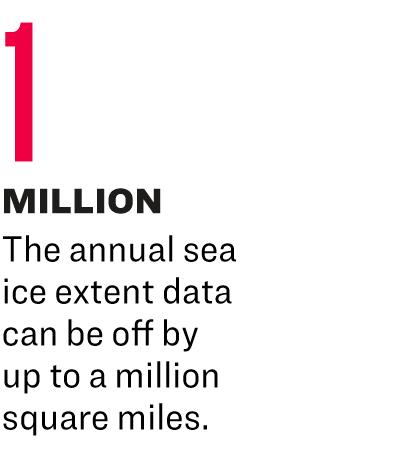
“During summer melt and freeze-up in the fall, the extent may be underestimated by 1 million square miles; during mid and late winter before melt starts, the error will be on the low end of the estimates,” NSIDC states.
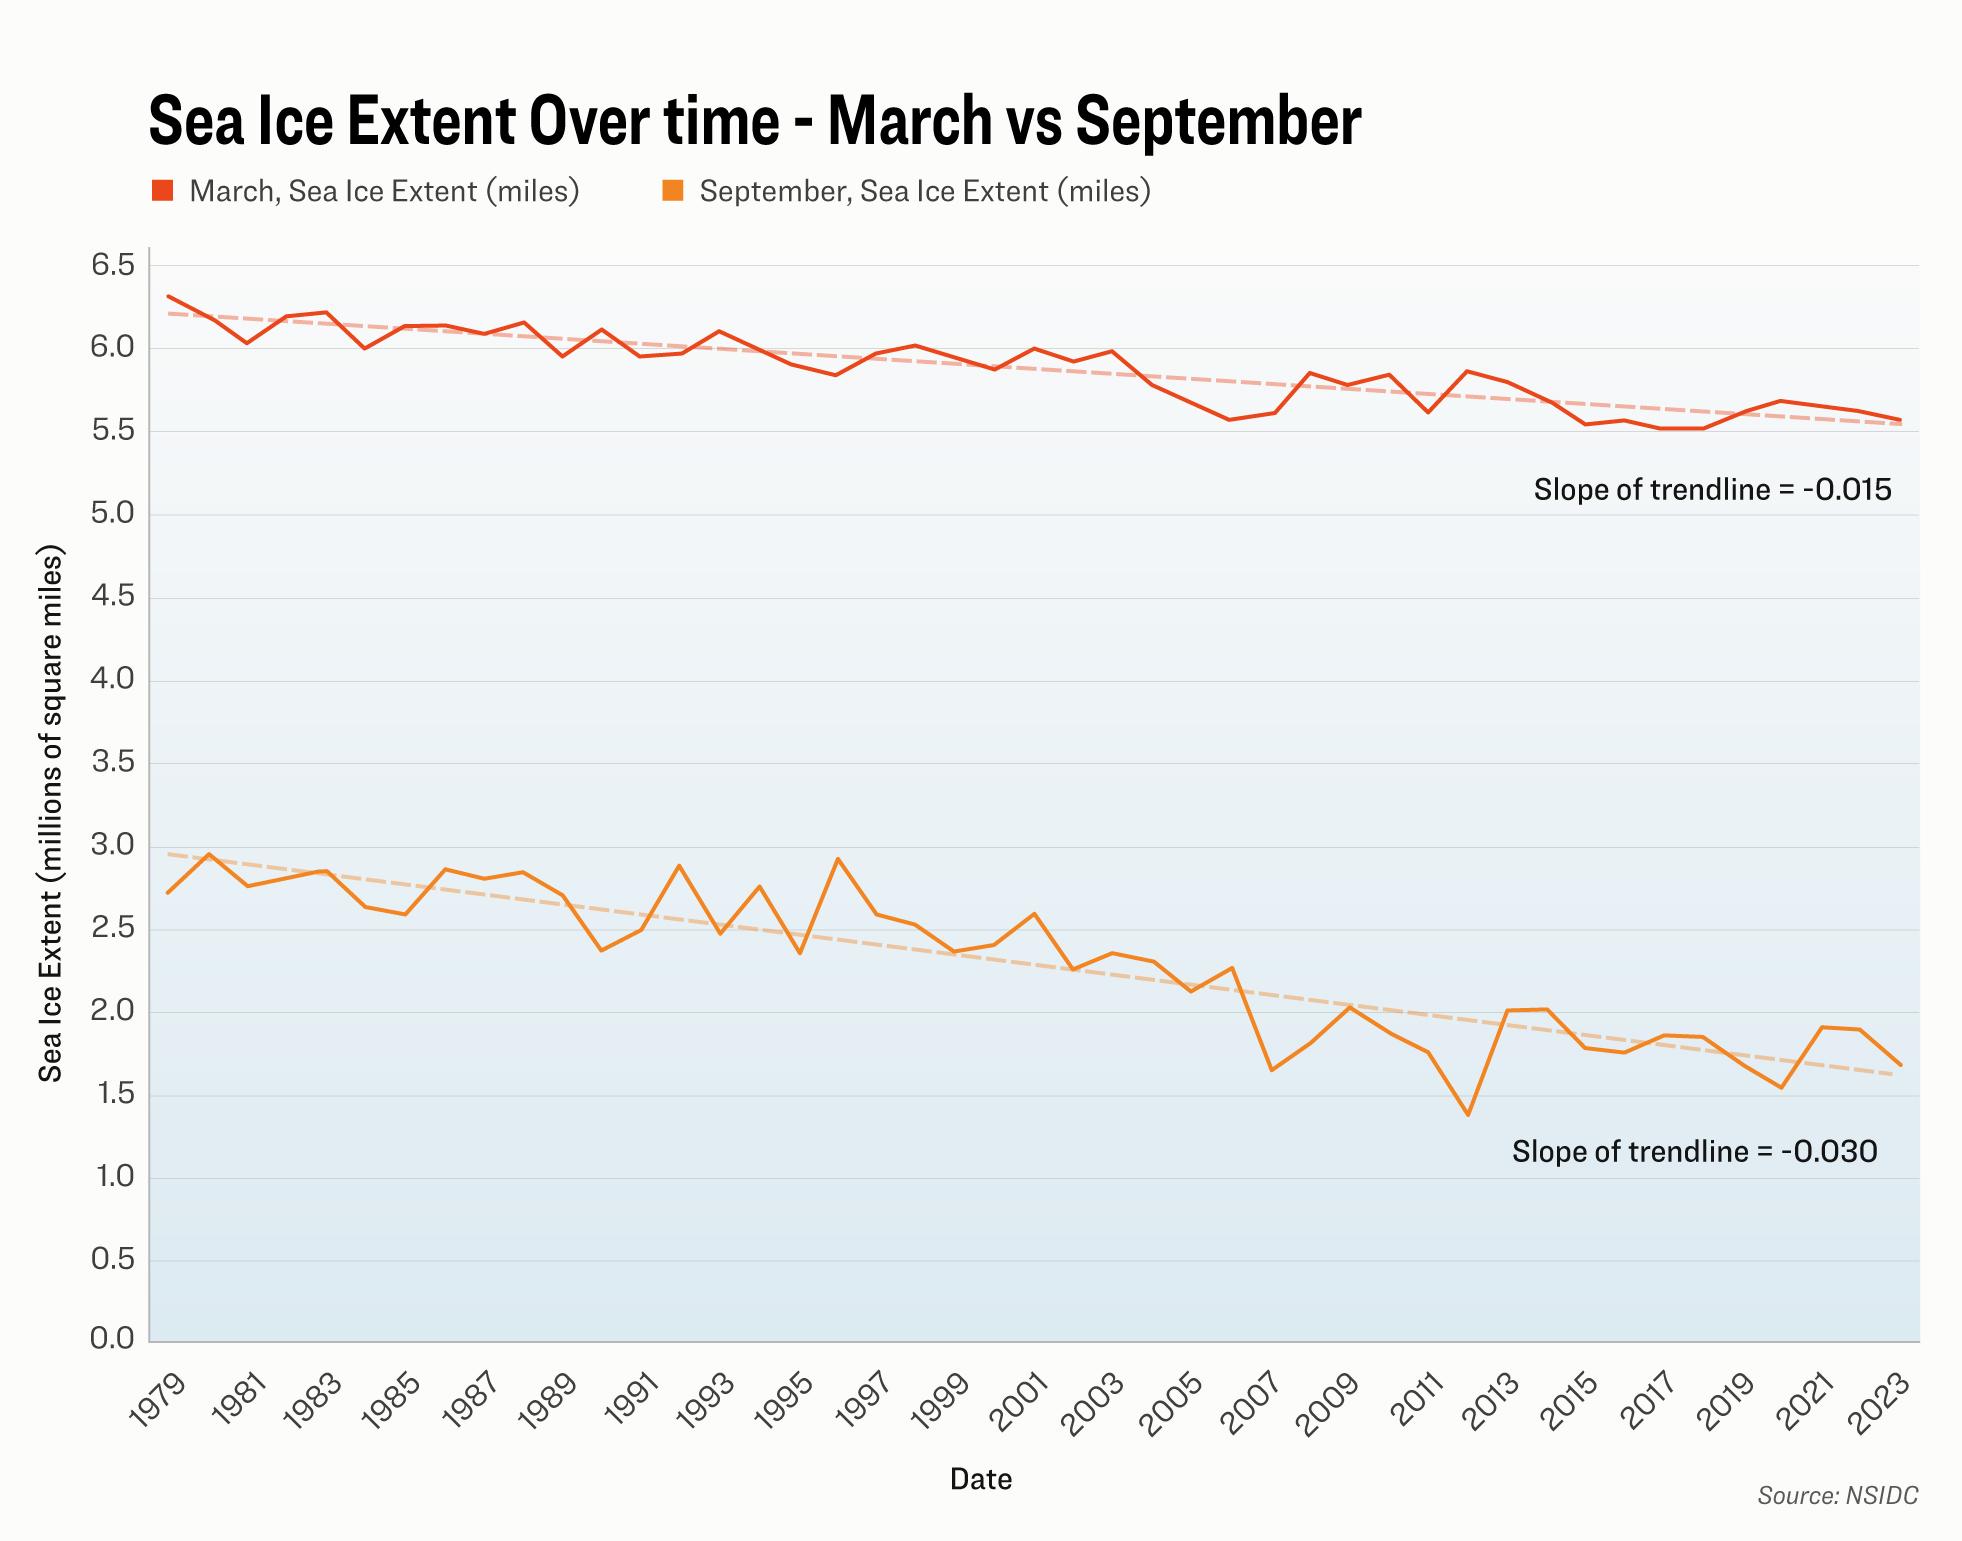
The sea ice area data can be off by up to a million square miles when measured in September, according to NSDIC, compared to March, which has a smaller margin of error.
When plotted on a graph, the decrease in sea ice extent from 1979 to 2023 using March’s more accurate number shows half the rate of decline at 15,000 square miles compared to September’s rate of decline at 30,000 square miles.
Climate models are only as good as the data put into them, Mr. Jensen said.
“The sharp decrease in Arctic Sea ice extent before 2007, when the Nobel Prize was delivered to IPCC and Al Gore, was supposed to continue forever. In that light, the predictions were fair,” he said.
However, when it became clear that the decrease had stopped, they should have stopped such predictions,” he said.
“That was, however, difficult politically for them because that would put the whole issue of climate change by CO2 in doubt since the Arctic Sea ice decline had been a major argument for the CO2 theory.”
Additionally, satellite imagery of sea ice extent didn’t start in 1979, despite most graphs using that as their starting point.
Using imagery from its old satellites, NASA has pieced together rough estimates of sea ice extent as far back as the 1960s.
Mr. Jensen pointed out that though the satellite images from the 1960s were not as accurate as today’s models, they still give an overall picture that doesn’t align with NOAA’s consistently declining sea ice extent claims.
“The extent was possibly lower in some years before 1978. Thus, 1978–1996 levels were possibly a maximum period. Such a max could show up again in the future if CO2 is not the driver of Arctic Sea ice extent,” Mr. Jensen said.
In an archived report from the early 1990s, IPCC states, “Since about 1976 the areal extent of sea-ice in the Northern Hemisphere has varied about a constant climatological level but in 1972–1975 sea-ice extent was significantly less.
“In the Southern Hemisphere since about 1981, sea-ice extent has also varied about a constant level. Between 1973 and 1980 there were periods of several years when Southern Hemisphere sea-ice extent was either appreciably more than or less than that typical in the 1980s.”
Mr. Jensen said “it seems clear” that changes in Antarctic Sea ice are driven mainly by El Nino and La Nina.
“Maybe the Gulf Steam from the Atlantic and other Pacific Ocean currents are the Arctic’s main sea ice driver? More research is needed,” he said.
NSIDC Responds
When asked to comment on Mr. Jensen’s report, NSIDC’s senior research scientist Walt Meier said it was “nothing new and contains no significant scientific findings.”
“2007 was a record low minimum. Using 2007 as the starting point is cherry-picking a start year to minimize the trend and does not provide a scientifically useful metric of change. The overall trend since the start of our consistent and continuous satellite data started in 1979 shows a strong downward trend over 45 years,” Mr. Meier told The Epoch Times via email.“The 17 years from 2007 to 2023 are the 17 lowest years in the record. Analysis of ice type and ice thickness shows a substantial decline in thickness with a near complete disappearance of the oldest and thickest ice in the Arctic. The Arctic sea ice environment is fundamentally changed from the 1970s and 1980s.”
Mr. Meier said NSICD only includes data from satellite images from 1979, “because it is the highest quality long-term record. Adding earlier data can provide further context, but doesn’t change the conclusions using the data starting in 1979.”
When asked why we haven’t seen a downward sea ice extent trend commensurate with increasing CO2 ppm—if CO2 is the primary driver of sea ice decline—Mr. Meier said, “Greenhouse gas emissions affect sea ice, and climate in general, as a long-term ‘thumb on the scale.’
“There is always variability in the climate, so we expect ups and downs. Global temperatures do not rise steadily each year—other factors, such as El Nino or La Nina—play a role as well. But greenhouse gasses add a little extra ‘fuel’ each year.”
Meanwhile, in the third highest monthly gain in 45 years, Arctic sea ice increased by 4.63 million square miles in December 2023, according to NSIDC’s latest report.
The sea ice extent increased by an average of 33,700 square miles per day, “markedly faster than the 1981 to 2010 average of 24,700 square miles per day,” the report stated.